Where the health data comes from
Two sources feed everything on this page. The first is the providers’ own status pages: Borderless aggregates them all, so instead of checking each provider’s page one by one, you monitor every provider from a single place. The second is the Borderless network itself. Status page data is augmented with real-world transaction data for each provider across the entire network. If a provider’s status page shows all-clear but transactions through that provider start failing across the network, Borderless notifies you — often before the provider has posted anything. That early signal is something only network-wide data can produce, and it’s the difference between failing over as an issue develops and waiting for a status page to catch up.Check a provider’s current status
Every provider card on the Network page carries a health indicator when health data is available. Open the provider’s drawer for the detail: the header shows a status badge reading one of Operational, Degraded, Partial Outage, Major Outage, or Maintenance, along with how many of its services are operational. Where health data exists, the header also shows an uptime bar — a day-by-day strip of color blocks covering recent history. Hover any day for its date, status, and (if not operational) the affected components. Green end to end means everything’s been operational.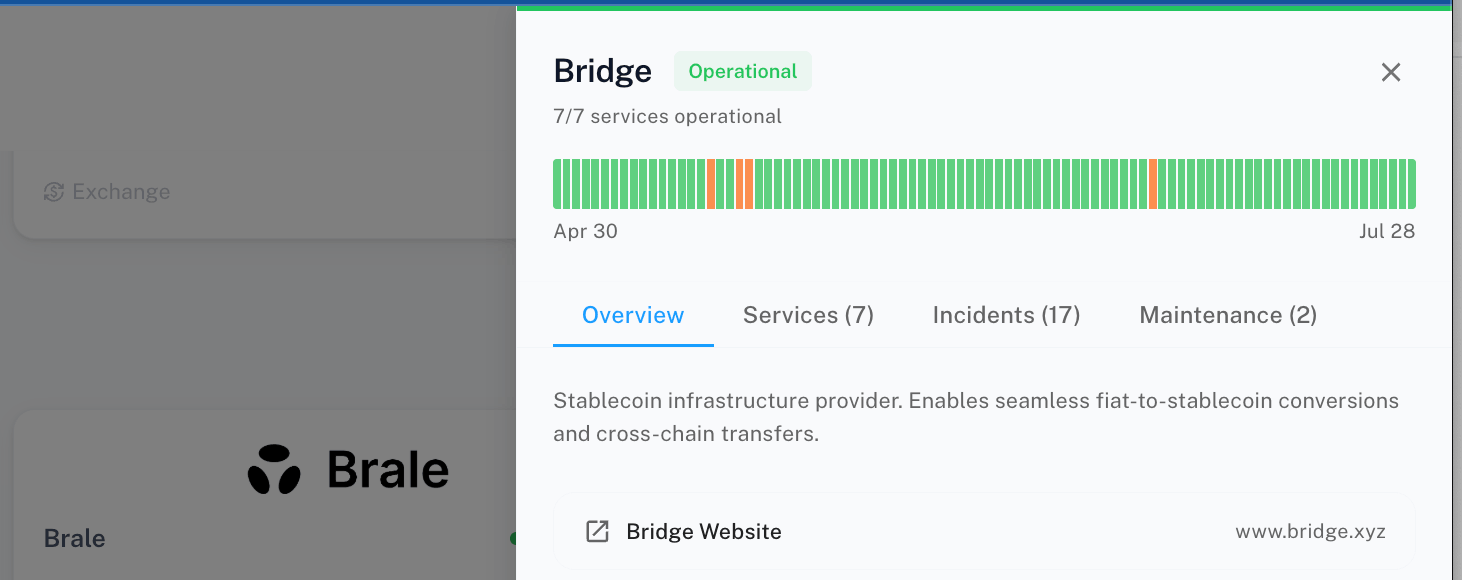
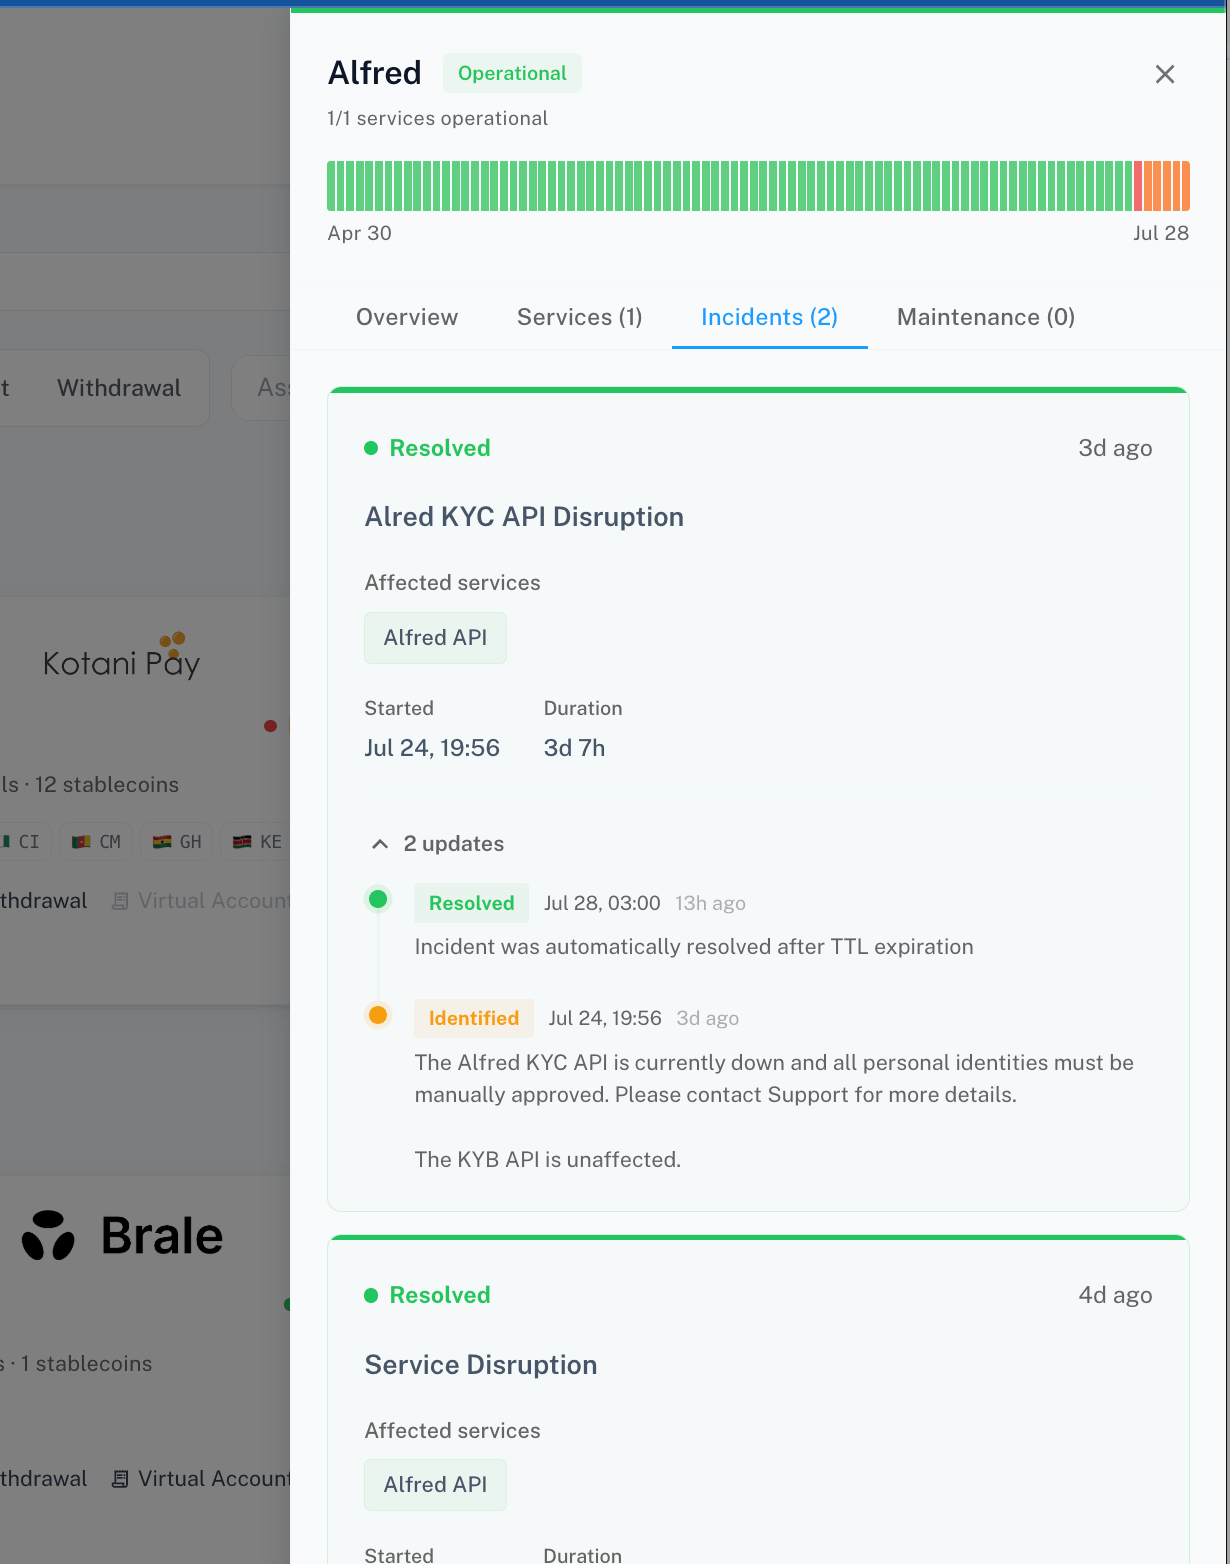
Review incidents
If the provider has live health data, the drawer shows tabs with live counts in their labels — for example Services (3), Incidents (1), Maintenance (0):- Services — one row per service, each with its own status, so you can see exactly which capability is affected.
- Incidents — active and past incidents.
- Maintenance — scheduled and completed maintenance windows.
Check upcoming maintenance
The Maintenance tab lists scheduled and completed maintenance windows, with the same card layout as incidents — affected services, start and duration. Scheduled maintenance also appears as a banner on the provider’s Overview tab. Check it before planning large payout batches through a provider.See health where it matters: on transactions
If a provider has an active incident, transactions routed through it warn you directly — the transaction’s detail page shows “This provider has an active incident — it may affect this transaction.” If a transaction seems slow, this is the first thing to check.At a glance, from anywhere
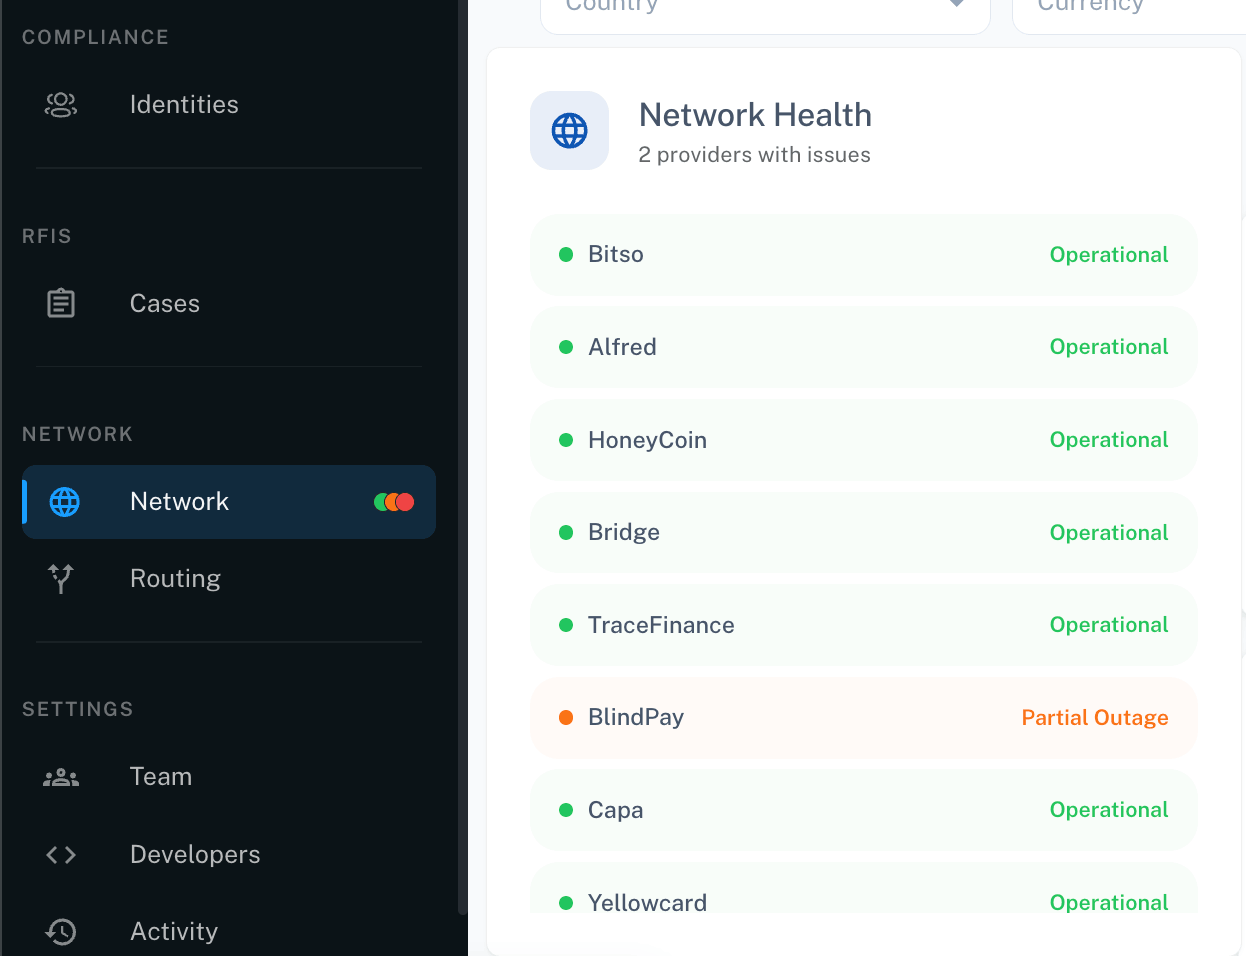
You don’t have to open the Network page to know where things stand:- In the nav: the Network item carries a real-time status indicator — a single green dot when every provider is healthy, green plus orange when some are degraded, and red when a provider is fully down. One dot appears per status present in your network, so a mixed picture is visible as mixed colors. Hover it for a summary of which providers have issues. It’s on screen wherever you are in the platform.
- On Home: the network health panel summarizes provider status across your network, so a developing issue is visible the moment you log in.