There are a lot of providers to choose from, their coverage overlaps, and each prices a little differently — which makes one simple question surprisingly hard to answer: am I getting a good price? Execution benchmarking answers it with numbers. Every transfer is graded against reference rates built from all the activity across the Borderless network on that corridor and direction, so you can see how competitive your provider mix actually is — and quantify it. And it grades what you actually care about: the all-in landed cost of the payment, not just the FX rate. Fees, spread, everything that separates what you spent from what arrived. Execution benchmarking is enabled per organization — talk to your Borderless representative if you don’t see the surfaces described here.

How grading works

Every eligible transfer is classified into one of three grades, based on how its executed rate compares to the weighted network average for that corridor and direction:
  • Competitive — better than the network average.
  • In Line — within one standard deviation of the network average.
  • Off Market — materially worse than the network average.
Differences are expressed in bps, and the comparison is on all-in landed cost. Figures carry an INDICATIVE tag throughout — the benchmark is directional guidance. Exchanges aren’t graded; benchmarking applies to money moving in and out. Some transfers can’t be classified yet, and the platform says so rather than guessing: Calibrating means the corridor doesn’t have enough recent observations, Syncing means the execution rate hasn’t been captured yet, and Stale benchmark means the corridor’s data may not reflect current rates.

See grades on the transactions list

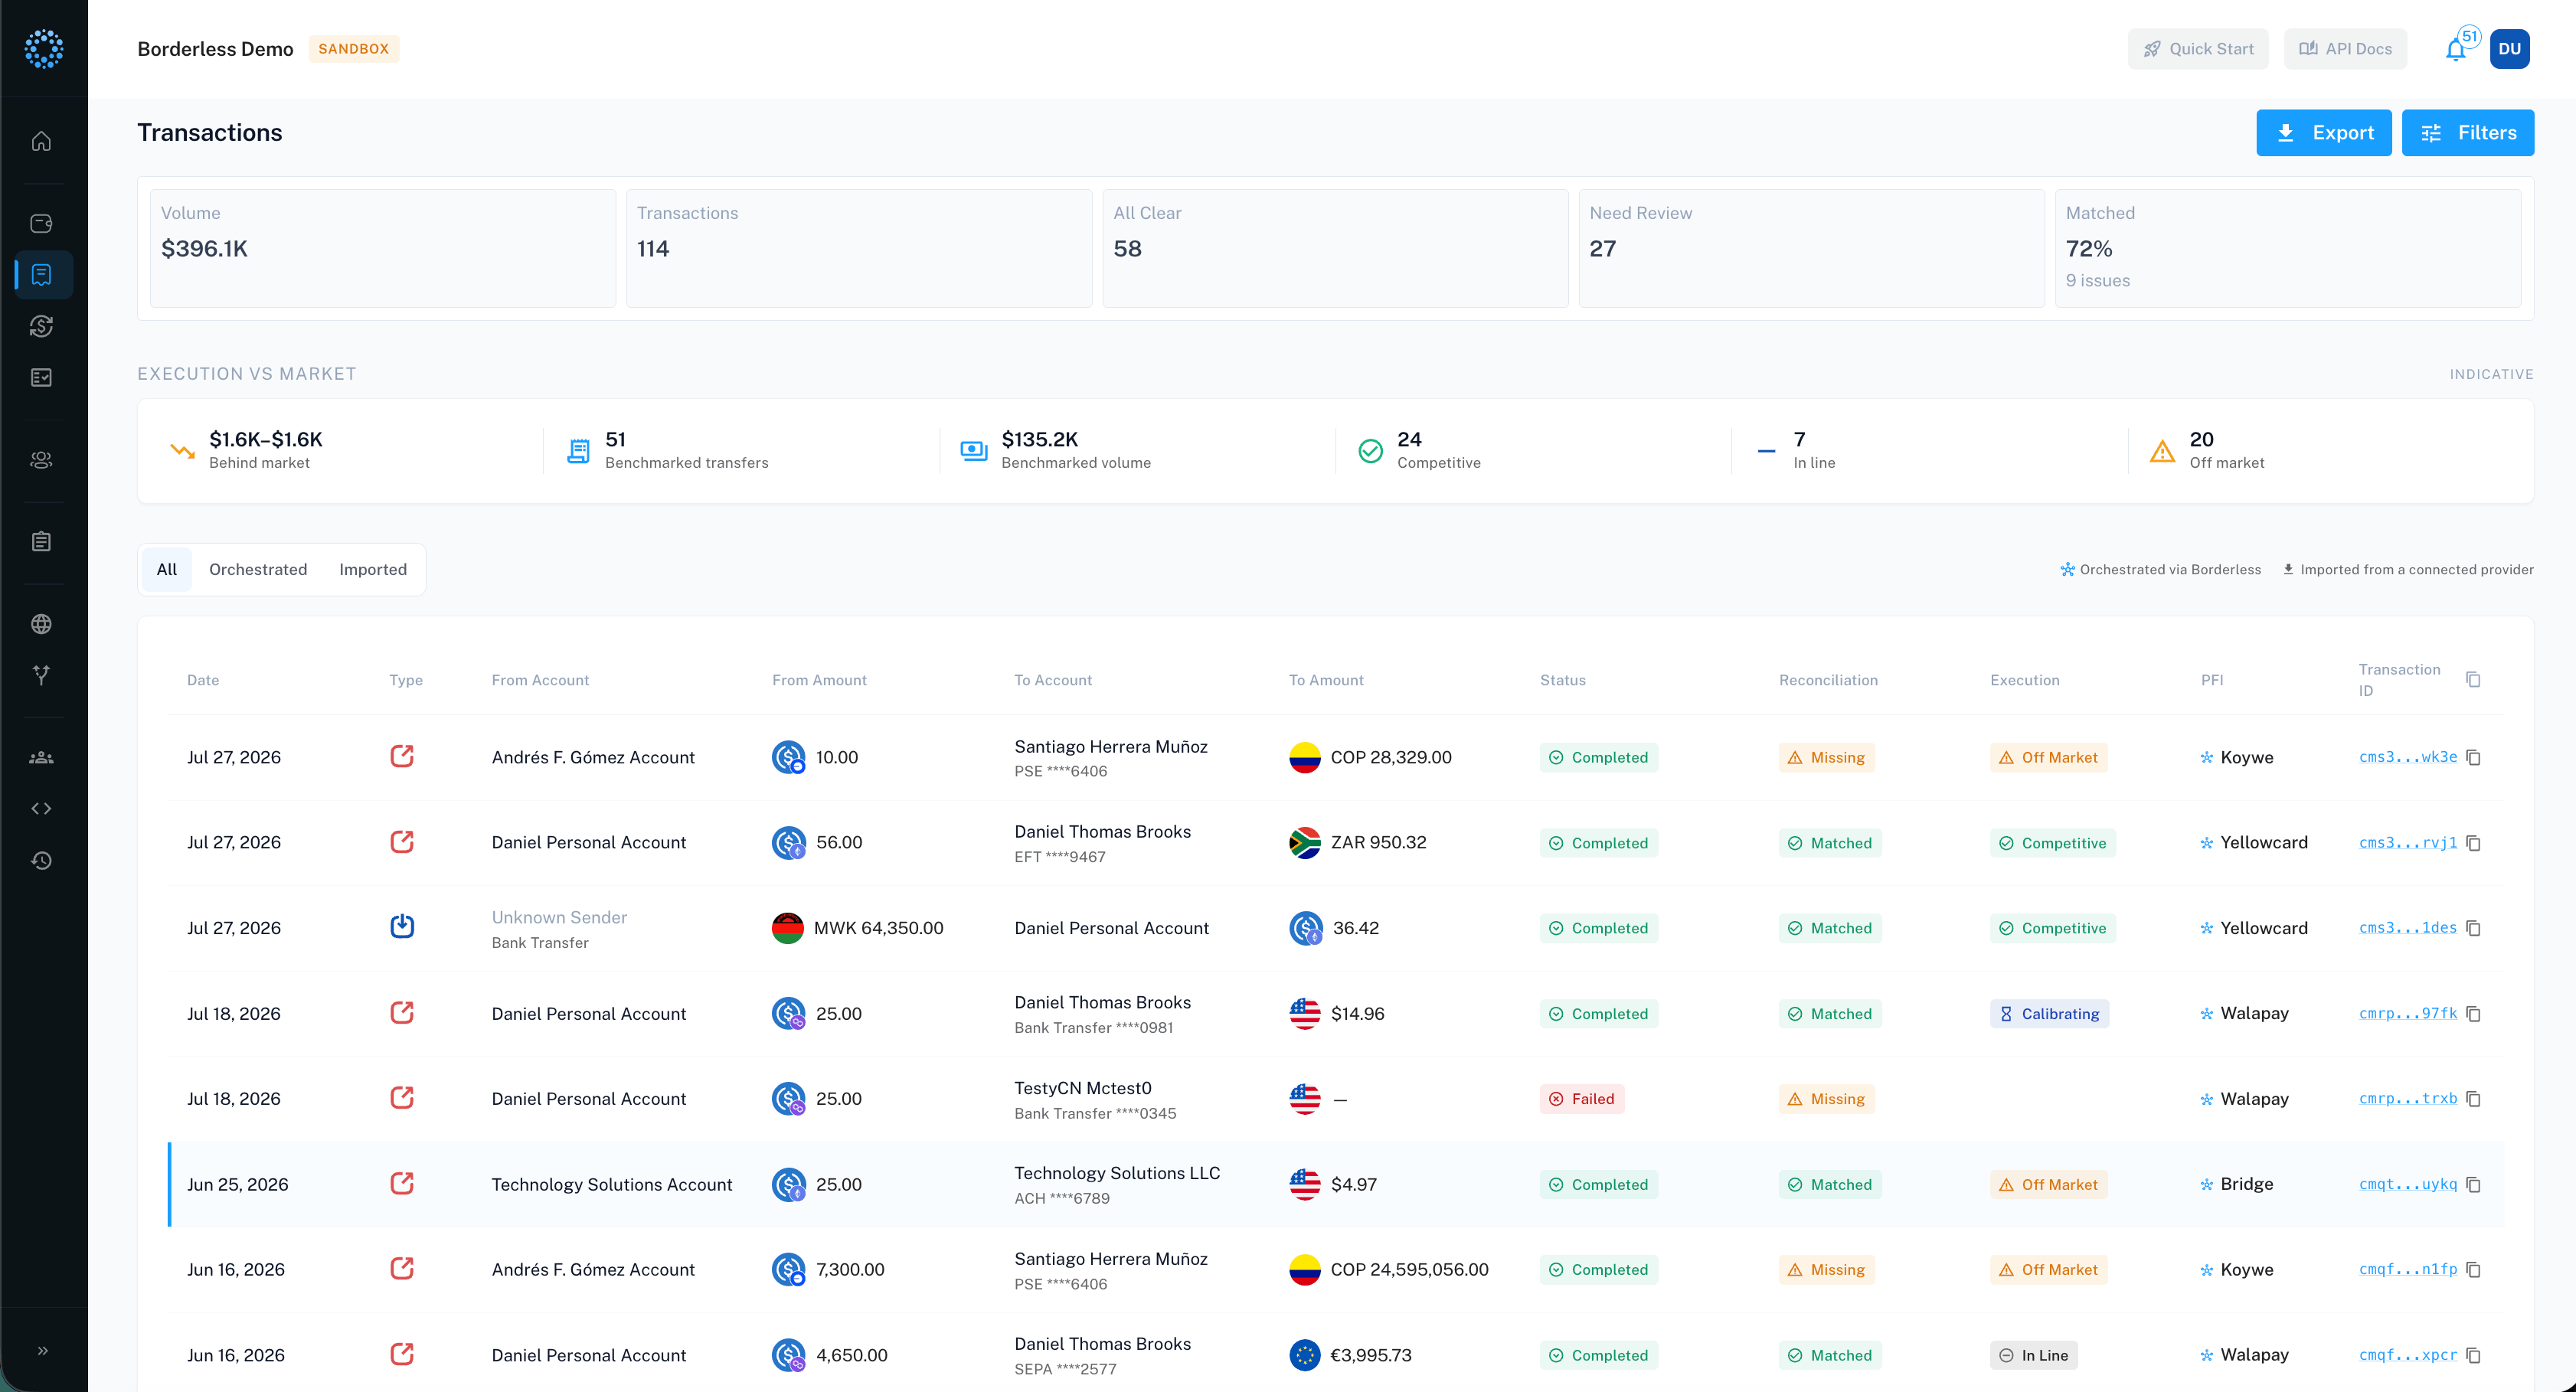
With benchmarking enabled, the Transactions table gains an Execution column showing each transfer’s grade as a chip — hover it for the explanation. Use Filters → Execution to narrow the list to a grade or state, for example everything Off Market this month. Transactions list with the Execution column showing Competitive and In Line chips
Read a transaction’s execution quality

Open any completed transfer and look for the Execution quality card. It shows:
  • The corridor and direction (for example “USDC → BRL ¡ Off-ramp”) with the verdict.
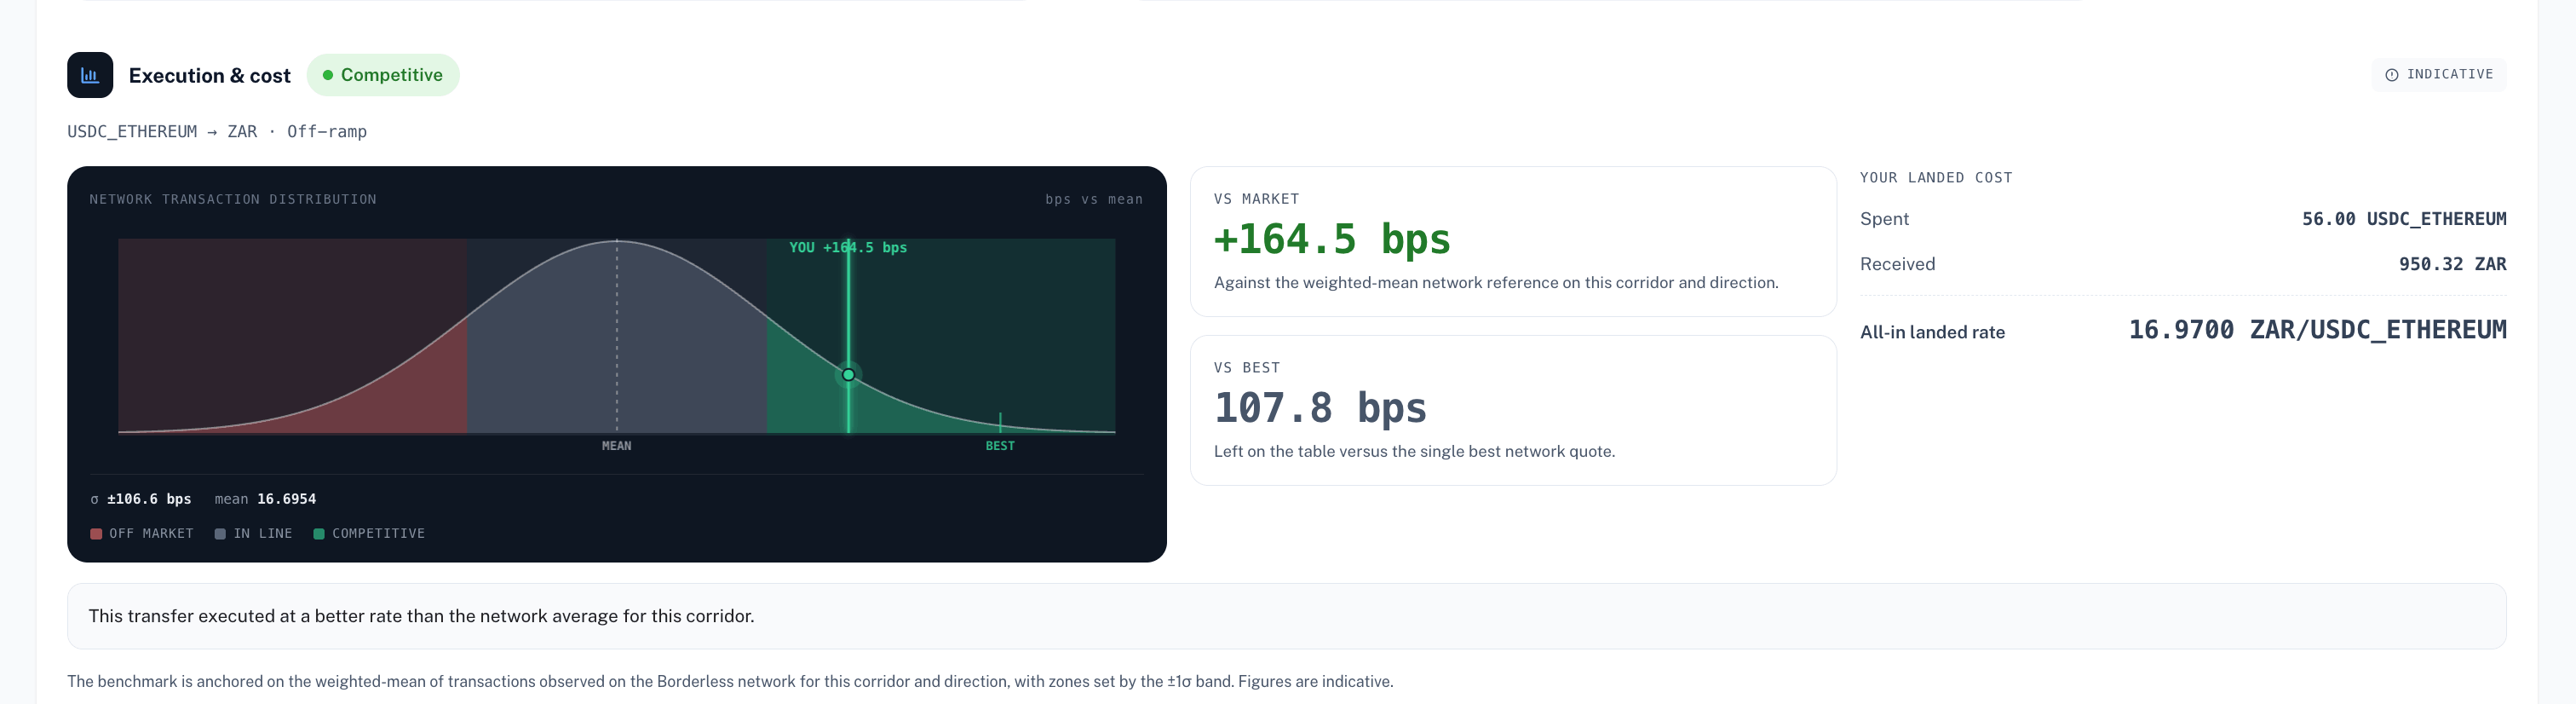
  • A network quote distribution strip — where your execution landed on the network’s distribution for this corridor, with the mean, the zones, and a marker for you (and the best quote, when available).
  • vs market — your signed distance from the weighted network average, in bps.
  • opportunity vs best — what was left on the table versus the single best network quote, in bps.
  • Your landed cost — what you spent, what was received, and the all-in landed rate, so the benchmark always sits next to the real economics of the transfer.
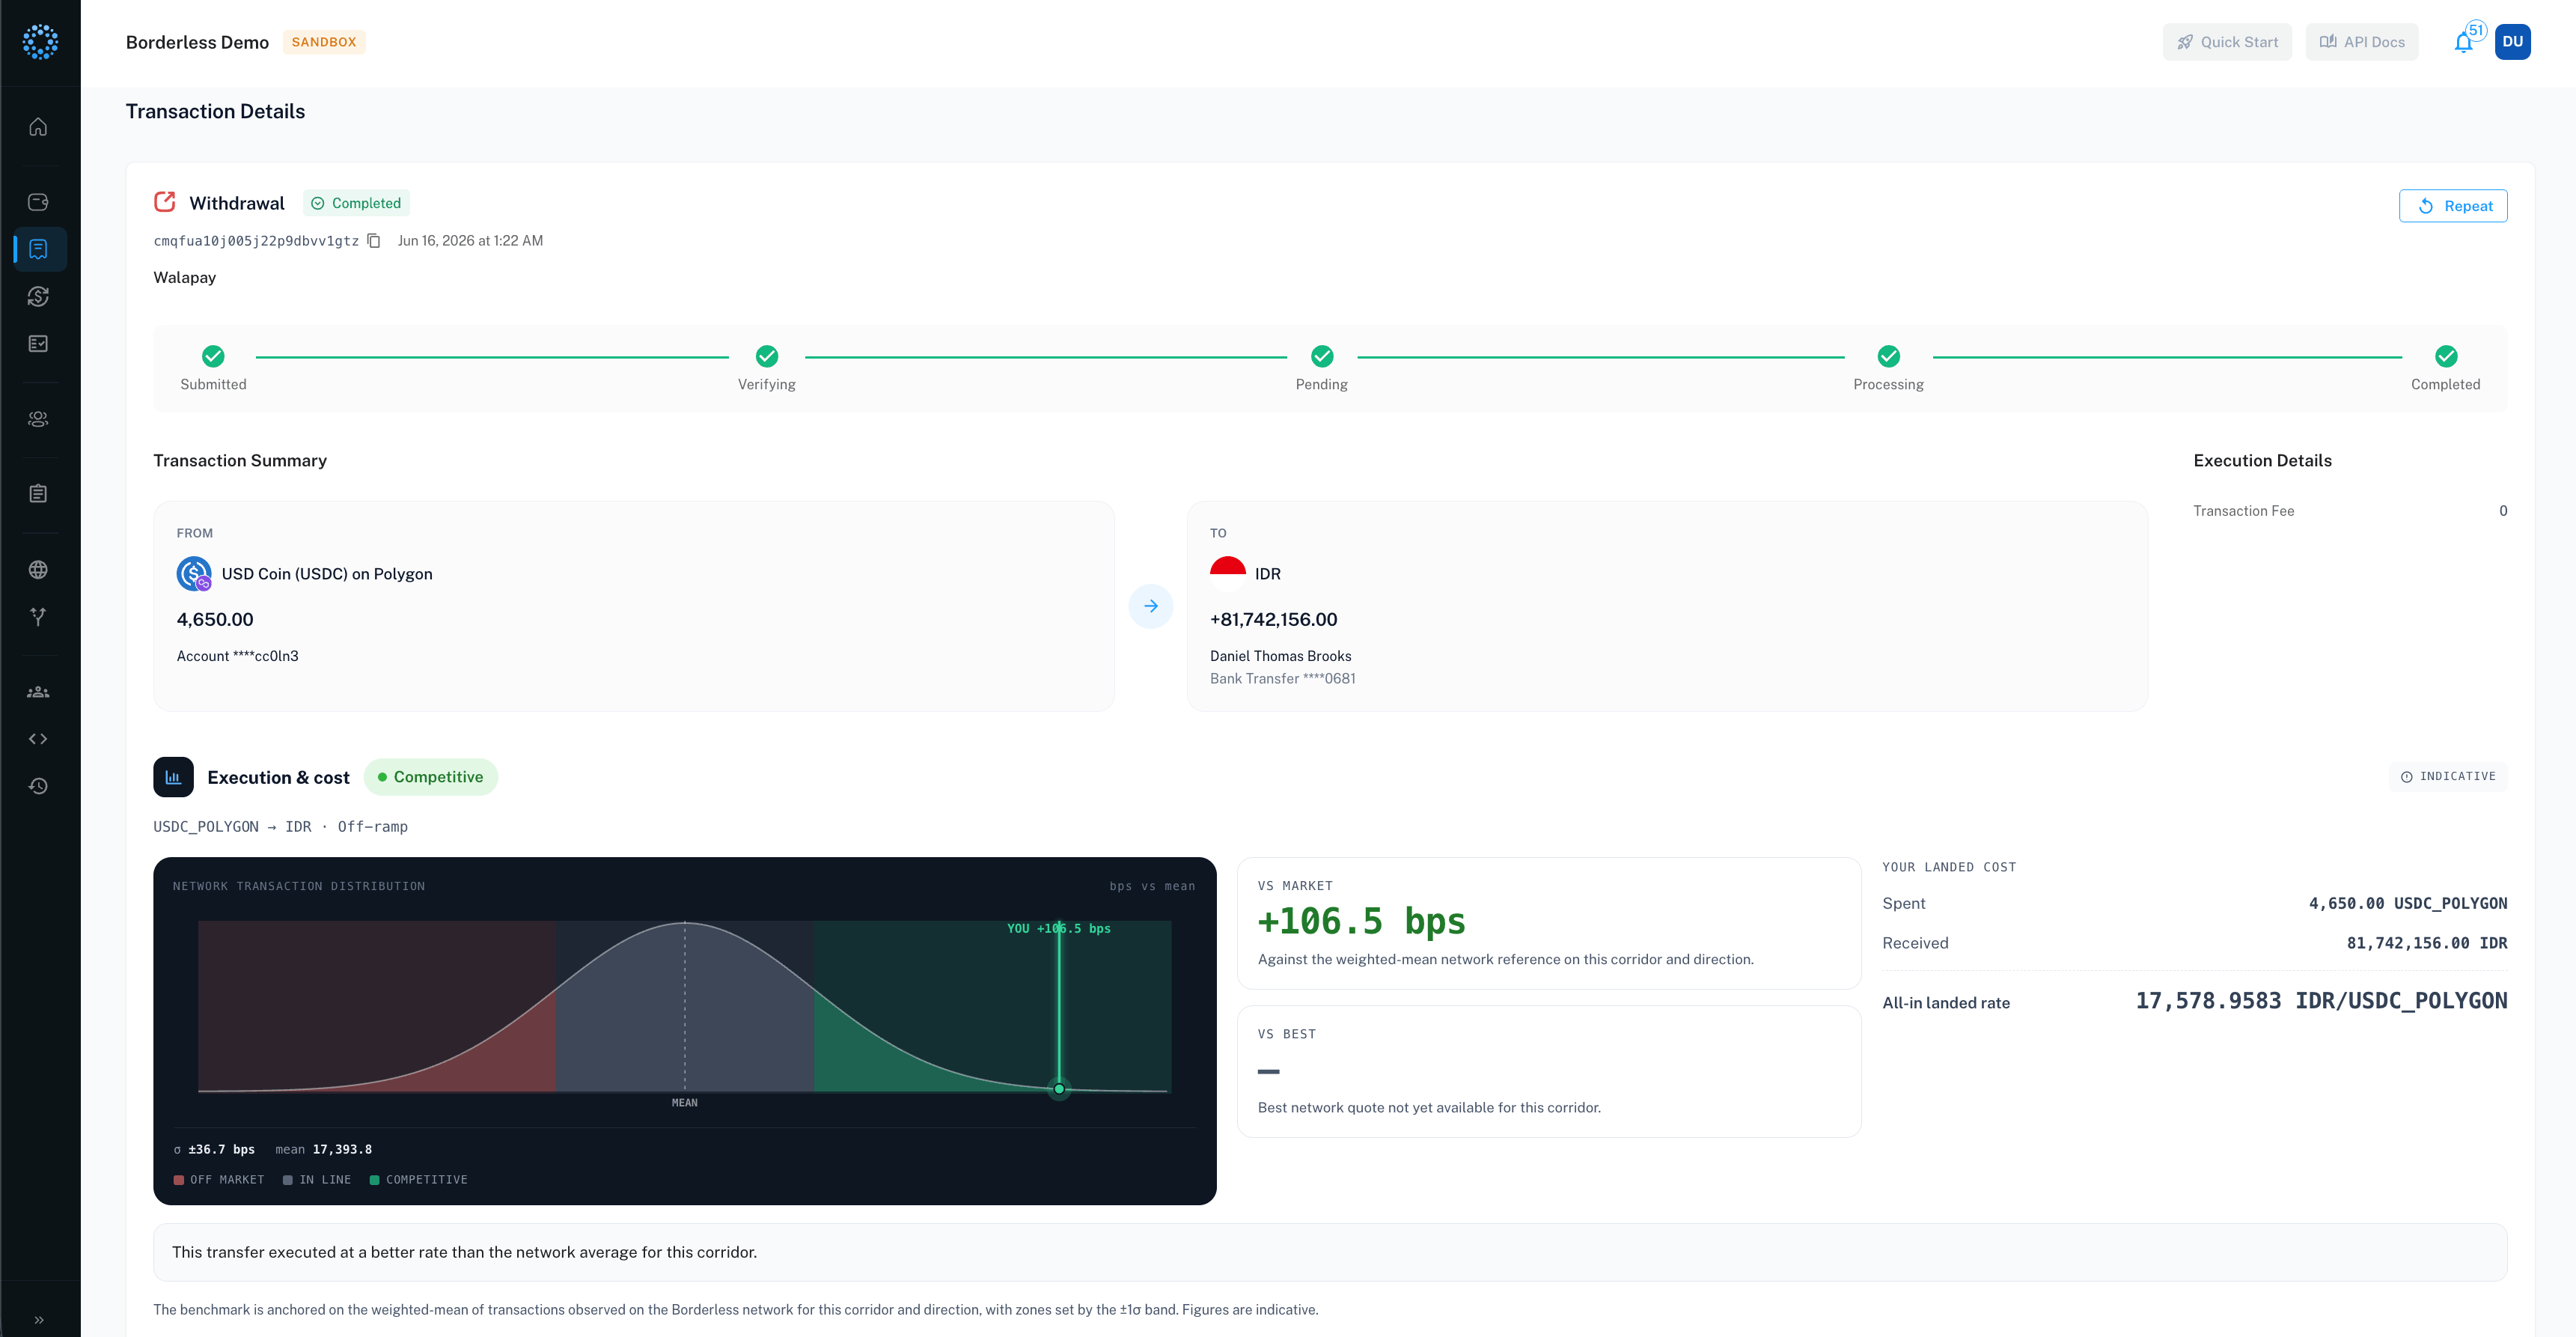
Execution quality card with the distribution strip and vs-market values The card appears once a transfer reaches a final state. If the corridor is still calibrating, syncing, or stale, the card says exactly that in plain language instead of showing numbers.

How transactions get benchmarked

Every transaction orchestrated by Borderless is benchmarked automatically — nothing to set up. If you also transact with providers directly through their APIs, outside the platform, you can have those transfers benchmarked too by importing them.

Importing transactions

There are two ways to import, both from the provider’s page in Network (Owner or integration permission required):
  • Link your provider — the way to go. Connect your credentials for the provider and Borderless imports your transactions in the background automatically, as an ongoing feed. Once linked, new activity flows in and gets benchmarked without you doing anything; Sync Now on the provider’s page triggers a pull on demand.
  • Upload a CSV. Import Transactions from CSV takes a file of off-platform transactions and validates it row by row before importing. It works, but it’s manual — every new batch means another upload. If a file has more than 100 valid rows, Borderless surfaces your top 100 by benchmark fit; linking the provider benchmarks everything, continuously.
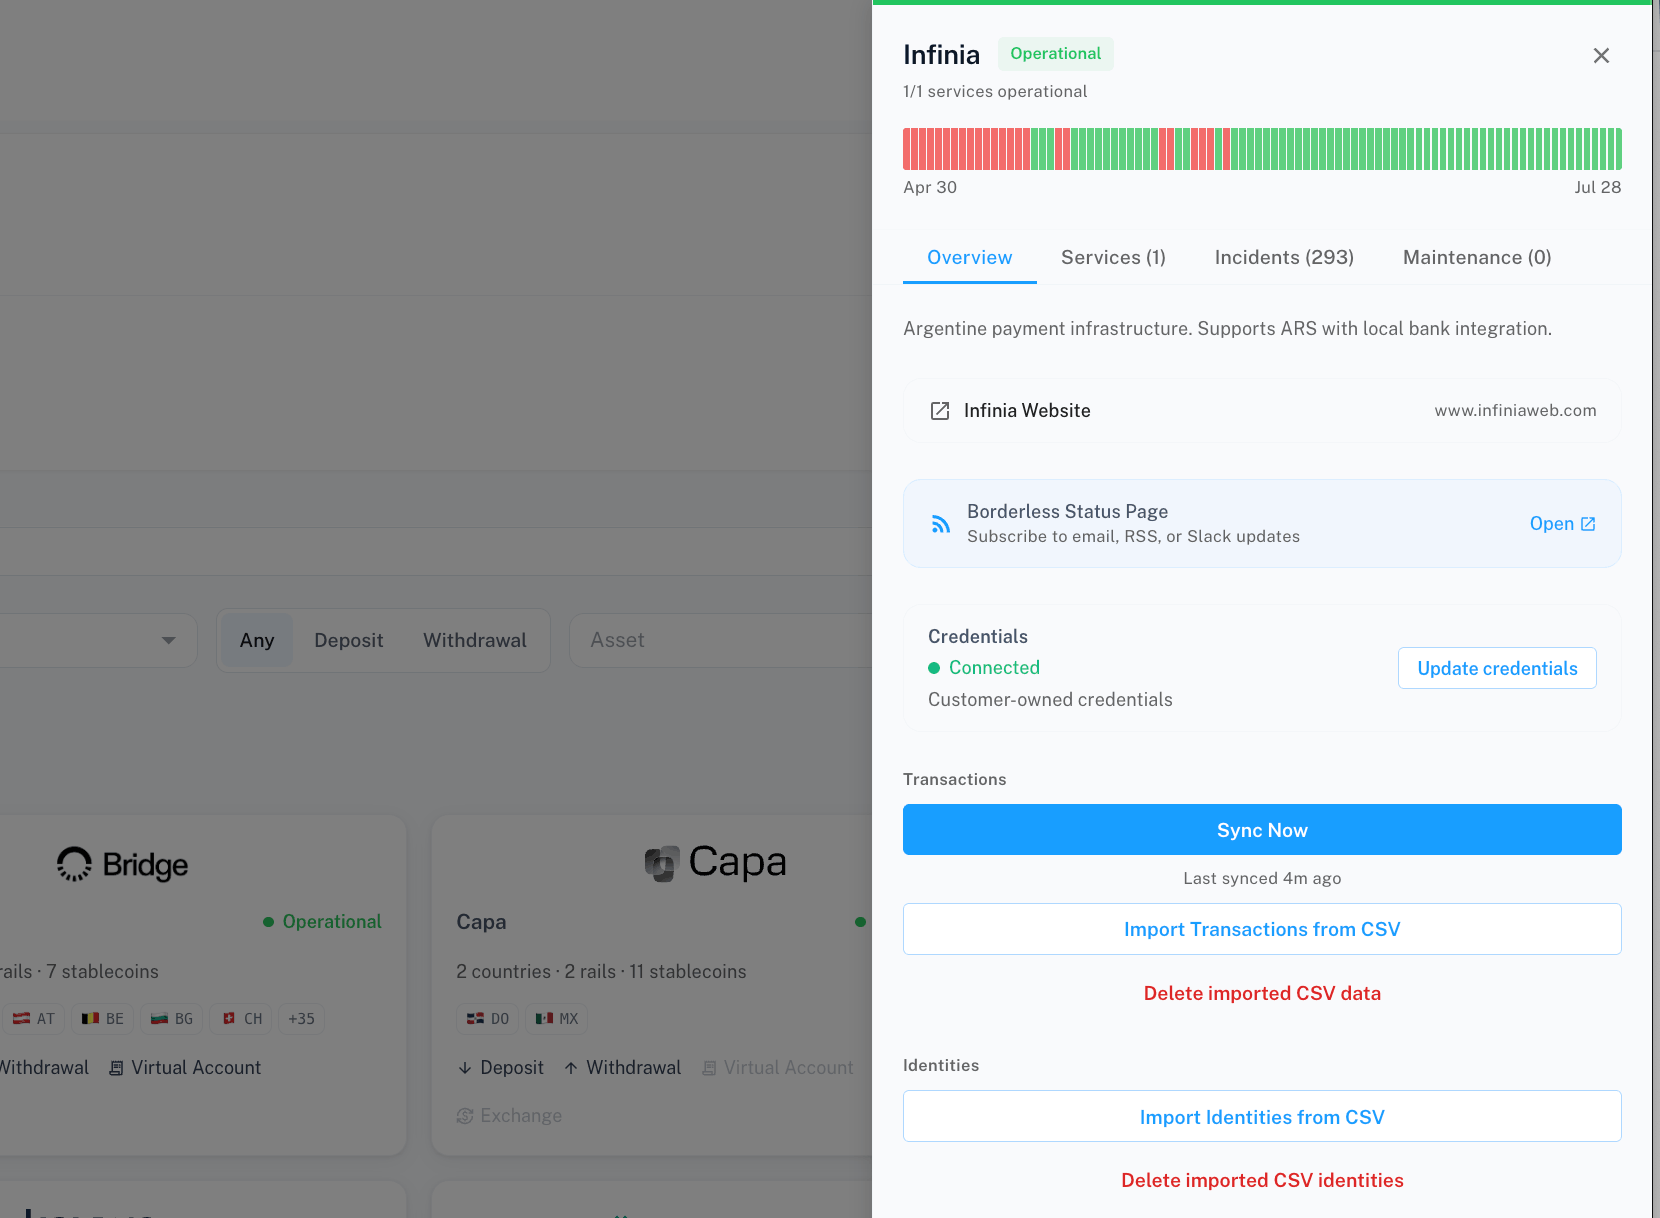
While an import runs you’ll see a banner — “Importing your transactions” — while Borderless fetches the data and computes benchmarking metrics; this usually takes up to 5 minutes. Imported transfers appear under the Imported tab on the Transactions page, get graded like any other transfer, and open to the same execution quality card. For imported transfers, the comparison excludes your own execution, so you’re measured purely against the rest of the network. Provider Overview tab with Sync Now and Import Transactions from CSV

Your portfolio versus the market

Once imported transfers are benchmarked, the Transactions page shows an Execution vs market summary card: whether you’re Ahead of market or Behind market in dollar terms across all benchmarked transfers, with a range and the sample size behind it. Until there’s enough data for a confident comparison, the card says so plainly. Execution vs market portfolio card showing Ahead of market
The stats strip

With benchmarking enabled, a strip of stats appears above the transactions list: the total dollar impact of your routing, and how many payments fall into each grade — Competitive, In Line, and Off Market. It’s the portfolio-level read at a glance, before you drill into any single transfer.

Troubleshooting

I don’t see an Execution column or execution quality card at all. Benchmarking is enabled per organization — contact your Borderless representative. A transaction shows no chip in the Execution column. Exchanges aren’t graded, and neither are transfers that ended before an execution rate was produced. The card says “Calibrating.” The corridor doesn’t have enough recent transfers for a reliable classification yet. Grades appear as network activity on that corridor accumulates. The card says “Syncing.” The execution rate for this transfer hasn’t been captured yet — backfill is in progress. Check back. “Stale benchmark.” The corridor’s benchmark data isn’t fresh; the card shows the last known grade and when it was current. Treat it as historical context, not a current verdict. My CSV import shows row errors. Each bad row is listed as “Row {n}: …” with what’s wrong. Fix the file and choose it again — only clean rows import. The portfolio card says there’s no confident comparison. You have benchmarked transfers, but not yet enough signal for a market comparison. It fills in as more transfers are benchmarked.